 August 13, 2026
Langfuse v4 is live
Query and evaluate every agent step directly, with initial table loads in milliseconds and at least 10x faster dashboards for large projects.
 Max Deichmann
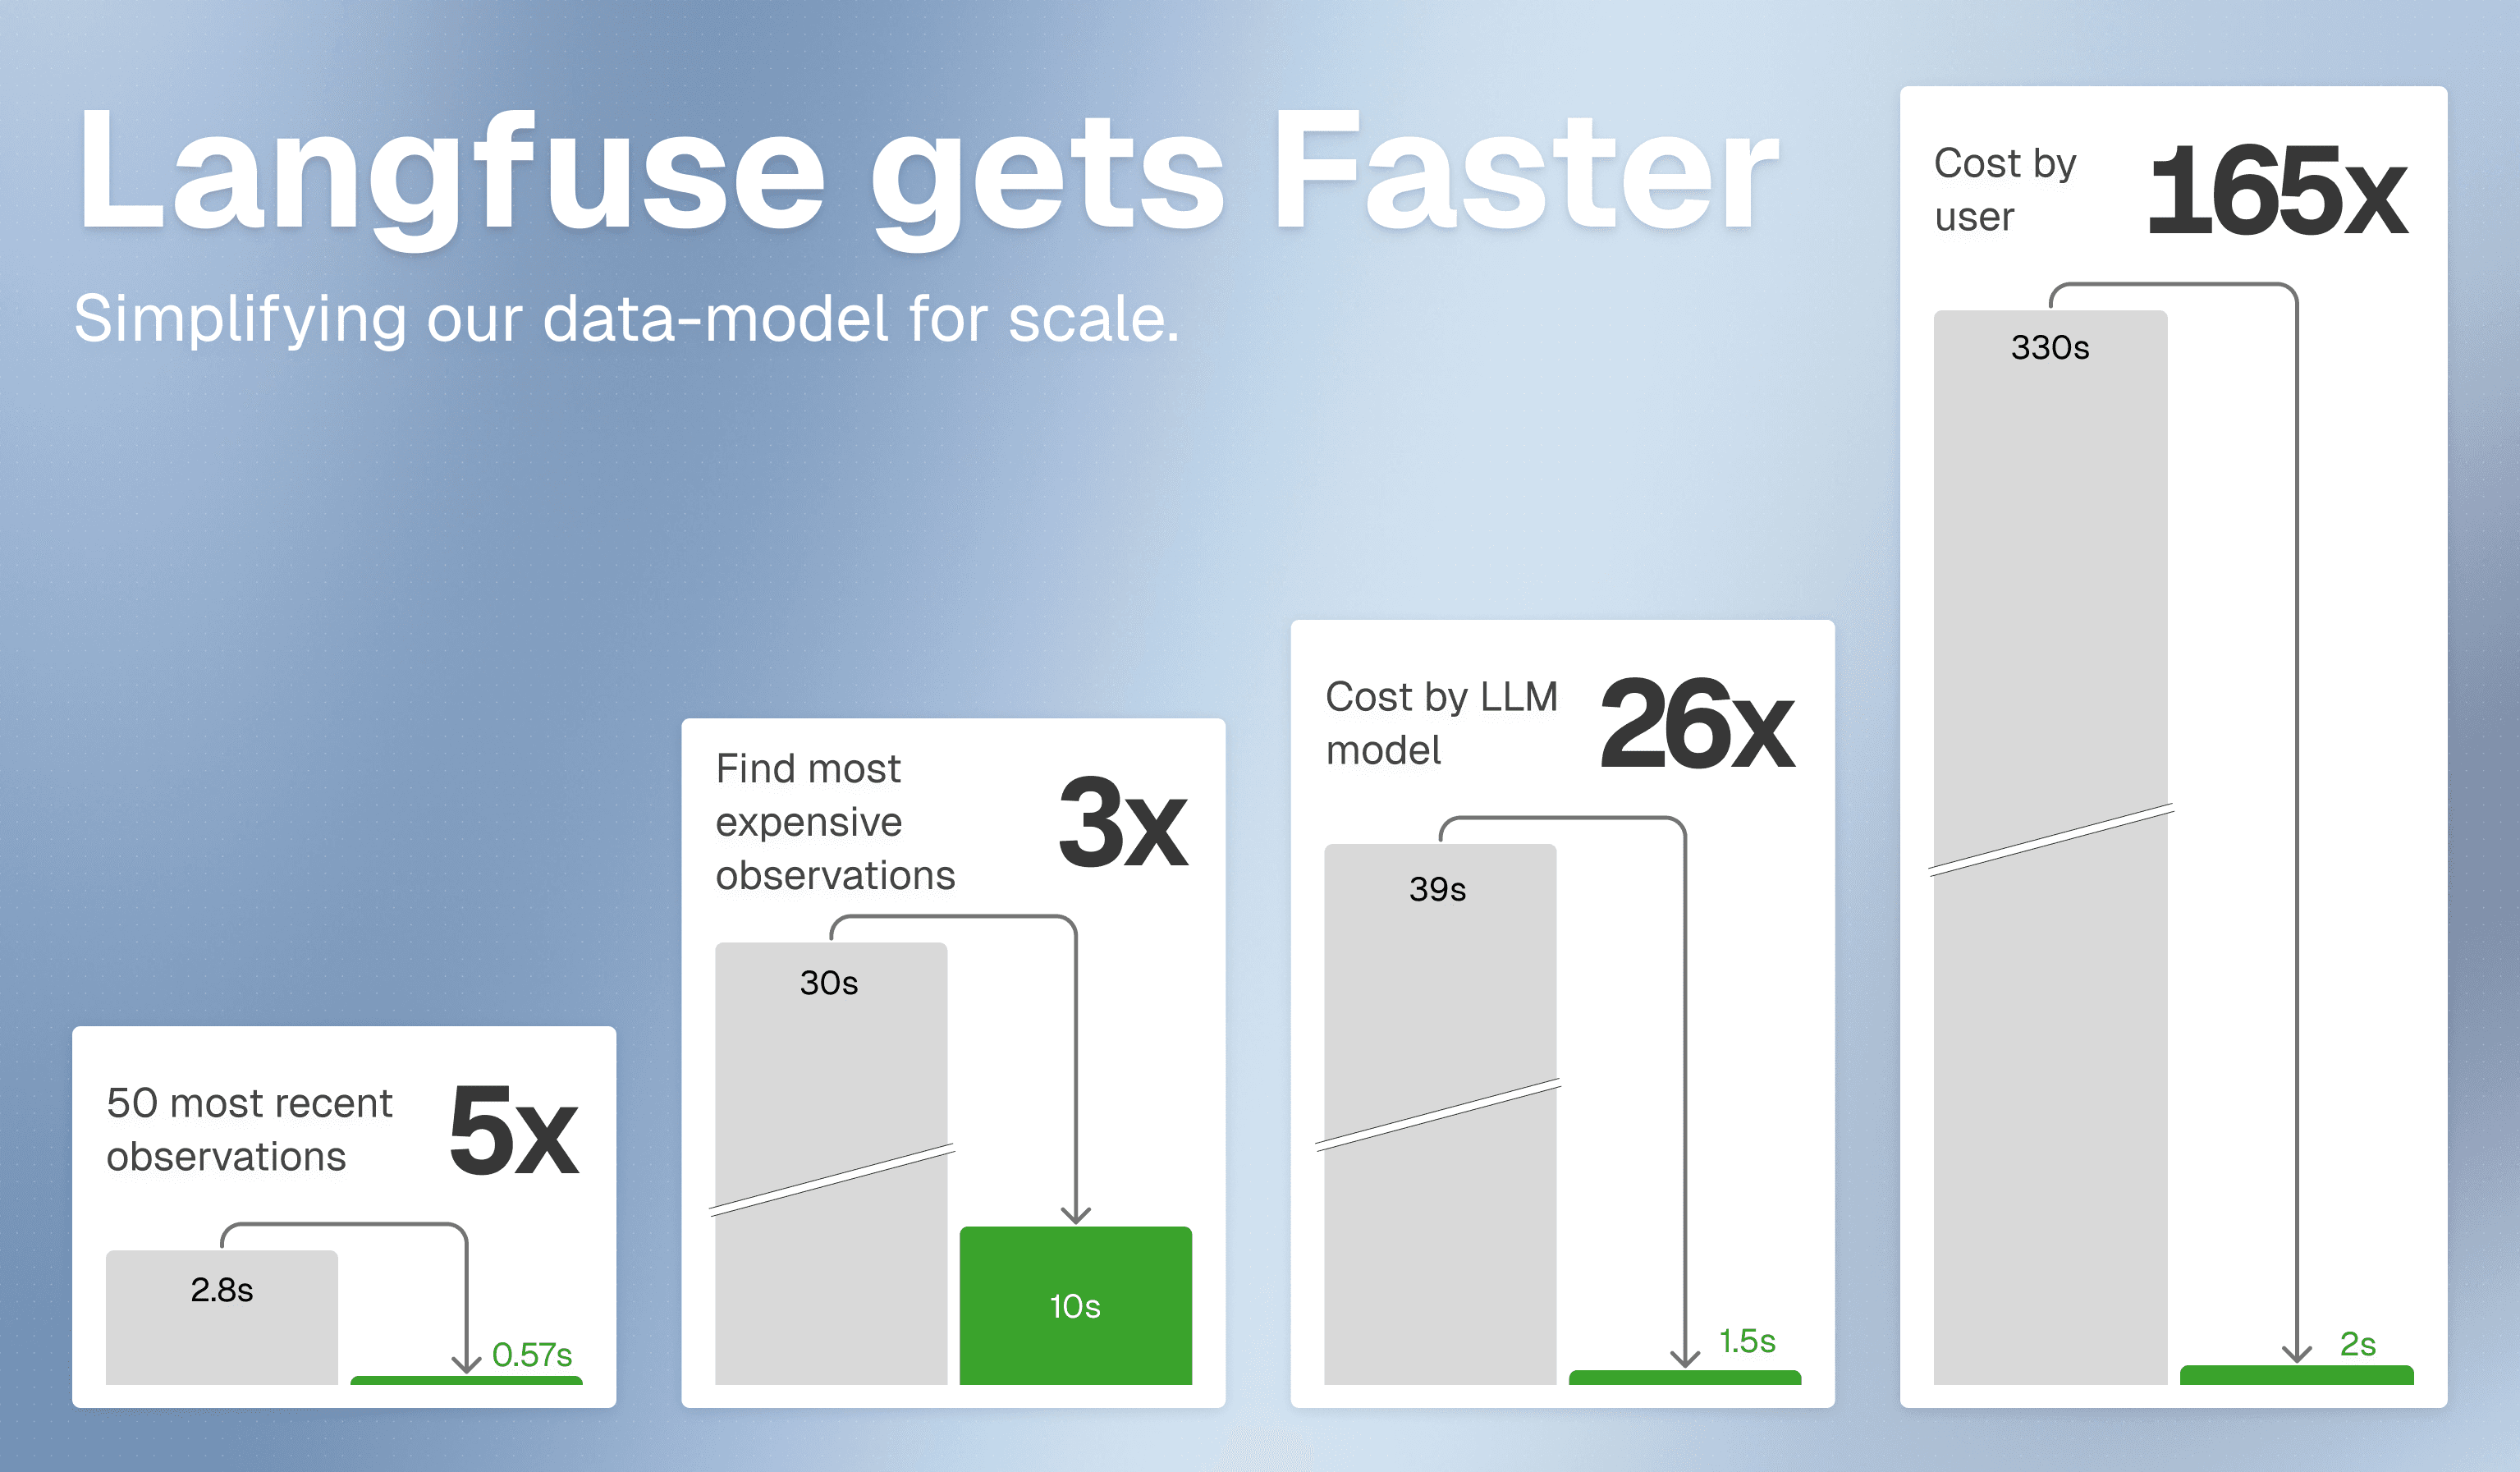
Langfuse v4 is live on Langfuse Cloud and generally available for self-hosted deployments. It makes it faster to debug, evaluate, and monitor complex LLM applications by letting you work with every LLM call, tool execution, and agent step directly. Initial table loads over large datasets drop from seconds to milliseconds, and dashboards over longer time ranges load at least 10x faster in large projects.
New to Langfuse
There is nothing to migrate. Start tracing with the v4 data model.
Using Langfuse Cloud
Open Action required and complete only the checks detected for your project.
Self-hosting Langfuse
Plan the upgrade on your schedule and review the infrastructure requirements first.
Every step in an application, such as an LLM call, tool call, or retrieval, is an observation. A trace groups the observations for one request. In v4, you can find the failed tool call inside a long-running agent, isolate the model calls driving a cost spike, or score one sub-agent's output directly.
Investigate any step across your agents
Agent traces can contain hundreds or thousands of operations. Langfuse v4 makes each operation directly searchable, so you can start with the question you need to answer instead of opening traces one by one.
Find the exact failure
Search inputs, outputs, and metadata across every tool call and agent step.
Spot cost and latency outliers
Use Pulse to jump from a spike to the observations that caused it.
Keep the views that matter
Turn a filtered table into a chart and add it directly to a dashboard.
Evaluate the relevant operation
Score one LLM call, tool execution, or sub-agent without evaluating the entire request.
Pulse keeps the aggregate and the underlying observations in one workflow, so investigating an outlier no longer starts with a full-table sort.
Upgrade Langfuse Cloud projects
New managed projects already use v4 and need no migration. For existing projects, open Action required in the sidebar. The panel is the source of truth for your project: it marks each category as Up to date, Not detected, or shows the number of affected items. Organization owners can use Migration Status for a project-by-project overview.
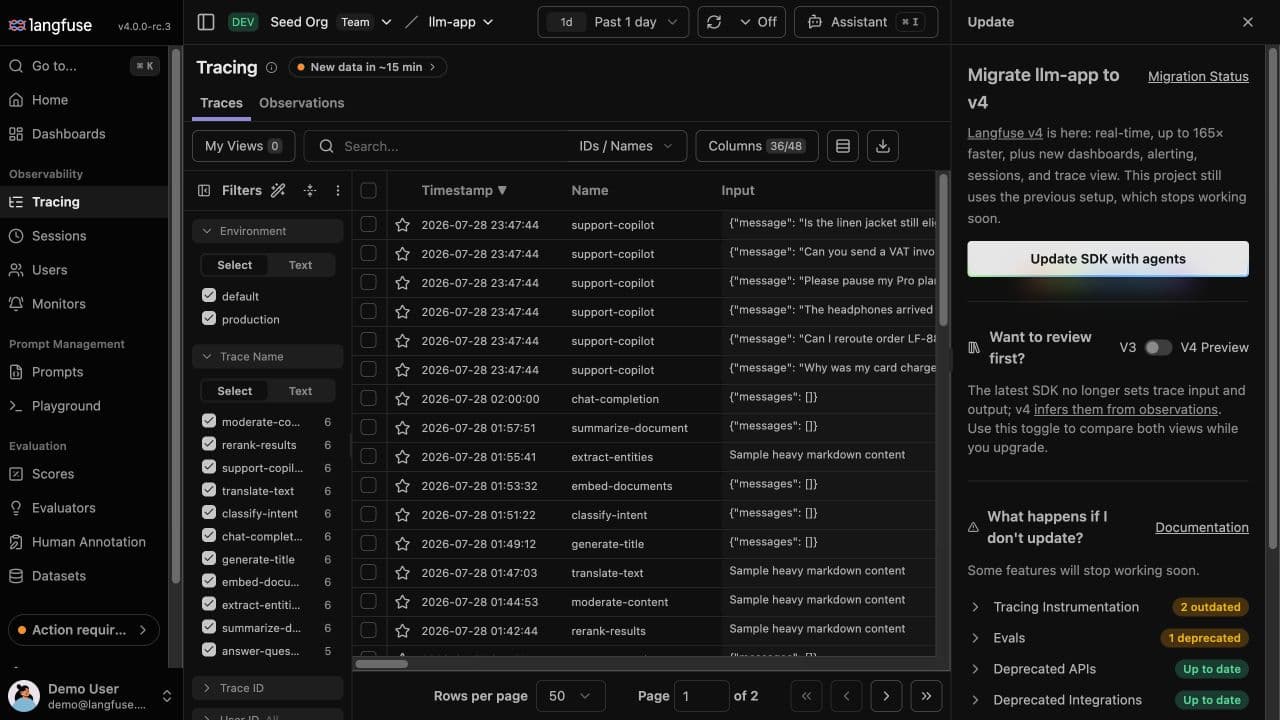
You only need to complete the actions shown for your project. Depending on what Langfuse detects, those can include:
- Upgrade to Python SDK 4.7.0 or later or JS/TS SDK 5.4.0 or later for real-time v4 ingestion.
- Migrate custom REST or OpenTelemetry ingestion to the v4 OTLP/HTTP path and validate a canary before moving production traffic.
- Replace deprecated API calls with the current Observations, Metrics, Scores, and Experiments APIs.
- Recreate trace-level evaluators with observation targets and legacy-dataset evaluators with experiment targets.
- Migrate blob storage, PostHog, and Mixpanel exports and their downstream consumers to enriched observations.
Before the Cloud cutover, older current-major SDK patches can take up to ten minutes to appear in v4. At cutover, legacy trace ingestion stops, deprecated read endpoints return 404, and trace-level evaluators stop producing scores. Remaining legacy Cloud exports switch to enriched observations.
We will email project owners and admins a summary of the actions detected for their projects. Action required remains the live source of truth. We will publish the exact Cloud cutover date in the v4 timeline. The Cloud upgrade guide covers every check and its migration steps.
Plan a self-hosted upgrade
Langfuse v4 is generally available for self-hosted deployments. There is no forced cutover date, and Langfuse v3 will receive security patches through January 2027.
Check your deployment topology first. Helm installations using the
chart's bundled ClickHouse (clickhouse.deploy: true) cannot upgrade yet
because the chart does not provide a v4-compatible ClickHouse upgrade path.
Deployments using an external ClickHouse are unaffected. Subscribe to the
self-hosting mailing list for updates.
The migration modes let you separate the server upgrade from the data-model cutover:
- Verify the infrastructure minimums: ClickHouse 25.12 or later, PostgreSQL 15 or later, and Redis 7.0 or later. If you will backfill historic data, plan roughly 3x your current ClickHouse data volume as temporary disk headroom.
- Before the first v4 deployment, choose a write mode. Use
legacyto retain full v3 behavior ordualto write both models while validating v4. Use the defaultevents_onlyonly when all producers and consumers are compatible. - Upgrade producers and migrate API consumers, evaluators, experiments, custom OpenTelemetry ingestion, exports, and their downstream consumers.
- If you started in
legacy, switch todualand verify that event propagation is healthy. - After dual write is healthy, run the online historic backfill or, if you enforce global retention, keep dual writing for one full retention window.
- Validate API reads, evaluator score counts, exports, and historic-data coverage, then switch to
events_only.
During dual, data from older producers can take about ten minutes to appear in the v4 view. Historic data appears gradually, newest first, during the backfill. Monitor the dual-write worker health check and background-migration status before treating either as missing data.
The switch to events_only is the point of commitment: old table writes stop, deprecated endpoints return 404, incompatible SDKs are rejected, and trace-level evaluators stop. While legacy or dual keeps the old tables current, you can roll the server back to the latest v3 release without a data gap.
The self-hosted v3 to v4 guide covers the migration variables, health checks, historic-data options, and rollback process. Check the compatibility matrix before choosing SDK and server versions.
How trace-level workflows change in v4
Traces remain the way to inspect one request end to end. For projects using Python SDK 4.7.0 or later or JS/TS SDK 5.4.0 or later, the Observations table opens with Is Root Observation = true by default, giving you a one-row-per-entry-point view. Remove the filter when you want to search every operation. Saved views and shared links retain their own filters.
The same model changes the interfaces around a trace:
| Previous pattern | v4 pattern |
|---|---|
| Trace-level input and output | Input and output on the relevant observation, usually the root observation |
| Trace-level LLM-as-a-Judge evaluator | Observation-level evaluator for one matching operation |
| Legacy dataset evaluator or dataset-run integration | Experiments that run from datasets or local test data |
| Legacy trace, span, generation, and event ingestion | OTLP/HTTP ingestion |
| Deprecated read APIs | Observations v2, Metrics v2, Scores v3, and Experiments APIs |
| Legacy traces-and-observations exports and consumers | Enriched observations and updated downstream consumers |
Only the patterns your project uses require migration. Observation-level evaluators see one matching operation at a time, so narrow their filters or update instrumentation when an existing evaluator combines data from multiple spans. If dashboards or alerts are operational controls, compare key charts before cutover because some counts and time buckets differ from v3.
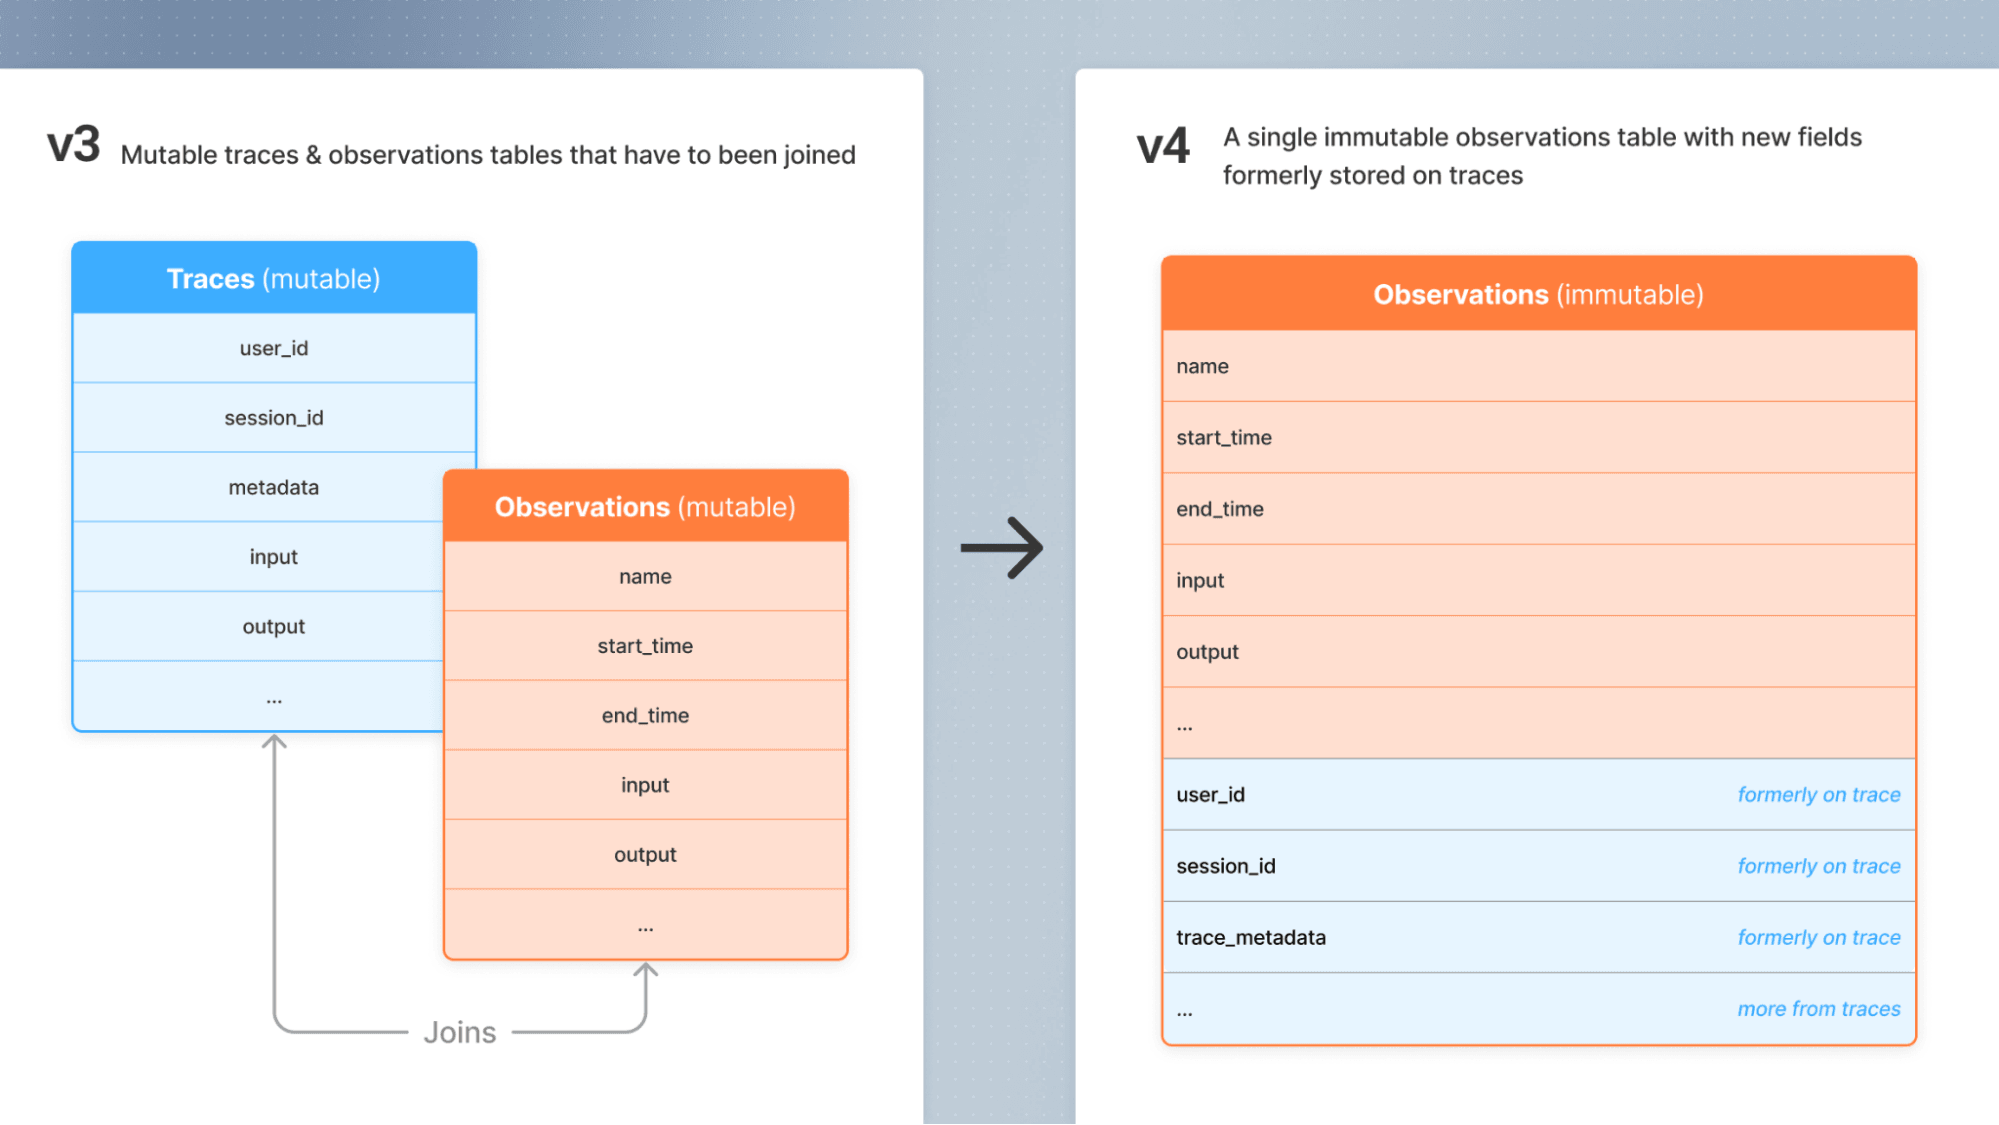
Denormalized observations remove read-time joins
Conceptually, v4 queries one denormalized observations model. Trace context such as user_id, session_id, and tags is propagated onto observations, so Langfuse does not need to join a trace table to an observations table when you filter or aggregate data.
Physically, Langfuse keeps a full-fidelity events table and a lighter projection for table and chart queries. Completed observations are written once on the direct ingestion path, which removes costly read-time deduplication. A small set of UI mutations still uses lightweight updates.
The same model powers full-text search, alerts, the Observations API v2, and the Metrics API v2.
For the implementation story and performance work behind this release, read Simplifying Langfuse for Scale.
Choose your next step
Get started with Langfuse
Trace your first application with the v4 data model.
Review your Cloud migration
Follow the instructions for each action detected in your project.
Upgrade a self-hosted deployment
Plan the infrastructure, dual-write, backfill, and cutover steps.
Ask about Langfuse v4
Join the dedicated GitHub Discussion for rollout and migration questions.